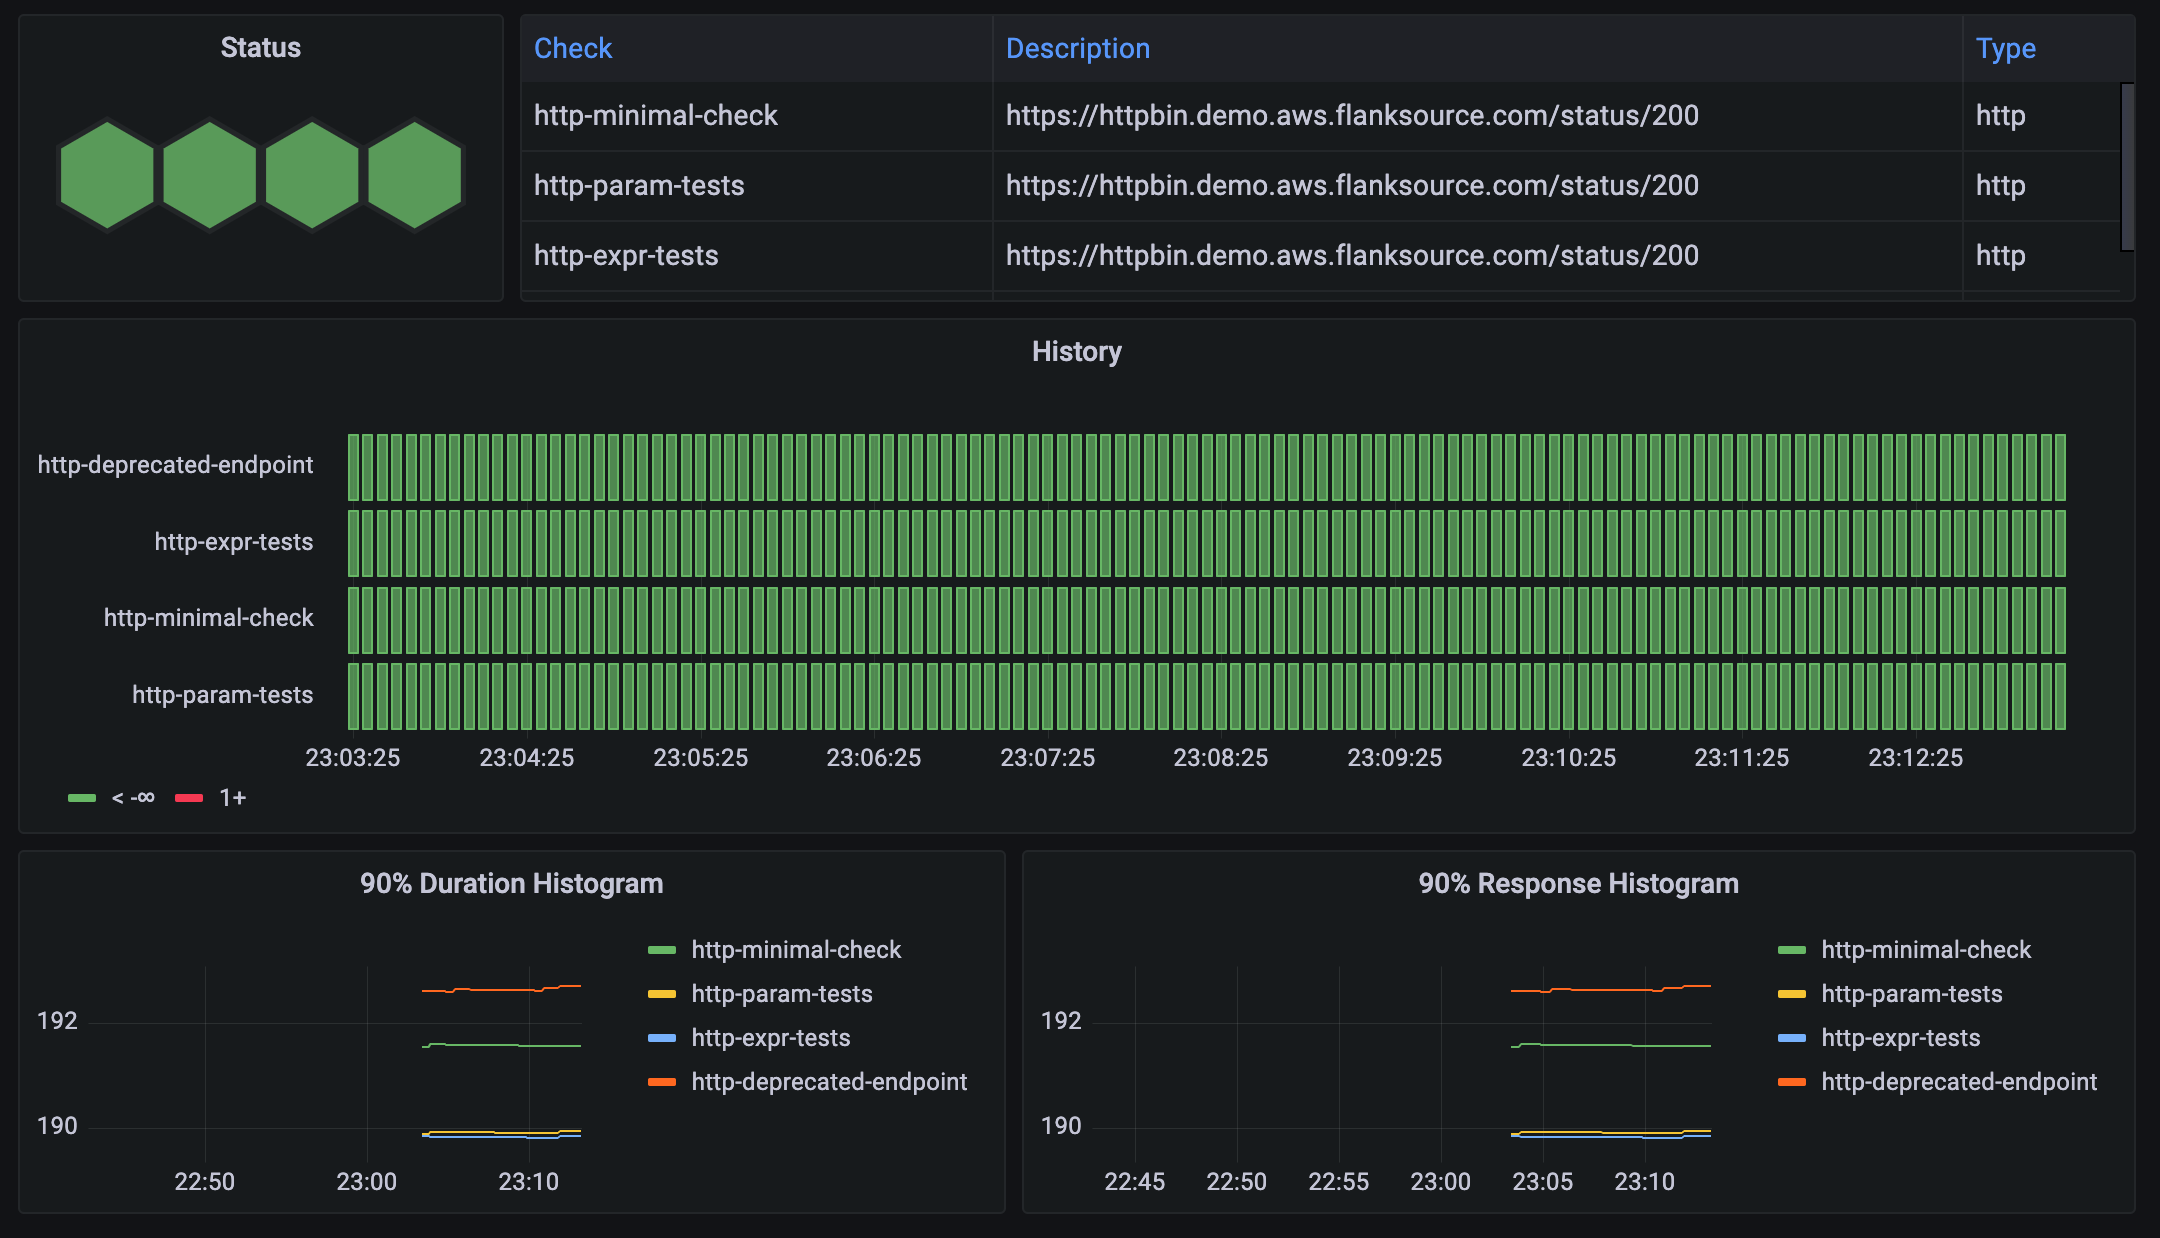
Metrics
Canary Checker works well with Prometheus and exports metrics for every check, the standard metrics included are:
| Metric | Type | Description |
|---|---|---|
| canary_check | Gauge | Set to 0 when passing and 1 when failing |
| canary_check_success_count | Counter | |
| canary_check_failed_count | Counter | |
| canary_check_info | Info | |
| canary_check_duration | Histogram | Histogram of canary durations |
Some checks like pod and http expose additional metrics.
Custom Metrics
Canary checker can export custom metrics from any check type, replacing and/or consolidating multiple standalone Prometheus Exporters into a single exporter.
In the example below, exchange rates against USD are exported by first calling an HTTP api and then using the values from the JSON response to create the metrics:
exchange-rates-exporter.yamlapiVersion: canaries.flanksource.com/v1
kind: Canary
metadata:
  name: exchange-rates
spec:
  schedule: "every 30 @minutes"
  http:
    - name: exchange-rates
      url: https://api.frankfurter.app/latest?from=USD&to=GBP,EUR,ILS
      metrics:
        - name: exchange_rate
          type: gauge
          value: json.rates.GBP
          labels:
            - name: "from"
              value: "USD"
            - name: to
              value: GBP

        - name: exchange_rate
          type: gauge
          value: json.rates.EUR
          labels:
            - name: "from"
              value: "USD"
            - name: to
              value: EUR

        - name: exchange_rate
          type: gauge
          value: json.rates.ILS
          labels:
            - name: "from"
              value: "USD"
            - name: to
              value: ILS
        - name: exchange_rate_api
          type: histogram
          value: elapsed.getMilliseconds()
Which would output:
exchange_rate{from=USD, to=GBP} 0.819
exchange_rate{from=USD, to=EUR} 0.949
exchange_rate{from=USD, to=ILS} 3.849
exchange_rate_api 260.000
Fields
| Field | Description | Scheme | Required |
|---|---|---|---|
metrics[].name | Name of the metric | string | Yes |
metrics[].value | An expression to derive the metric value from | CEL with Check Context that returns float | Yes |
metrics[].type | Prometheus Metric Type | counter, guage, histogram | Yes |
metrics[].labels[].name | Name of the label | string | Yes |
metrics[].labels[].value | A static value for the label value | float | |
metrics[].labels[].valueExpr | An expression to derive the label value from | CEL with Check Context | |
metrics[].labels[].labels | Labels for prometheus metric (values can be templated) | map[string]string |
Expressions can make use of the following variables:
Check Context
| Fields | Description | Scheme |
|---|---|---|
* | All fields from the check result | See result variables section of the check |
last_result.results | The last result | |
check.name | Check name | string |
check.description | Check description | string |
check.labels | Dynamic labels attached to the check | map[string]string |
check.endpoint | Endpoint (usually a URL) | string |
check.duration | Duration in milliseconds | int64 |
canary.name | Canary name | string |
canary.namespace | Canary namespace | string |
canary.labels | Labels attached to the canary CRD (if any) | map[string]string |
Prometheus Operator
The helm chart can install a ServiceMonitor for the prometheus operator, by enabling the serviceMonitor flag
--set serviceMonitor=true
Grafana
Default grafana dashboards are available. After you deploy Grafana, these dashboards can be installed with
--set grafanaDashboards=true --set serviceMonitor=true

Stateful Metrics
Metrics can be generated from time based data, e.g. logs per minute, logins per second by using the output of one check execution as the input to the next.
apiVersion: canaries.flanksource.com/v1
kind: Canary
metadata:
  name: "container-log-counts"
spec:
  # The schedule can be as short or as long as you want, the query will always search for log
  # since the last query
  schedule: "@every 5m"
  http:
    - name: container_log_volume
      url: "http://elasticsearch.canaries.svc.cluster.local:9200/logstash-*/_search"
      headers:
        - name: Content-Type
          value: application/json
      templateBody: true
      test:
        # if no logs are found, fail the health check
        expr: json.?aggregations.logs.doc_count.orValue(0) > 0
      # query for log counts by namespace, container and pod that have been created since the last check
      body: >-
        {
          "size": 0,
          "aggs": {
            "logs": {
              "filter": {
                "range": {
                  "@timestamp" : {
                    {{-  if last_result.results.max }}
                    "gte": "{{ last_result.results.max }}"
                    {{- else }}
                    "gte": "now-5m"
                    {{- end }}
                  }
                }
              },
              "aggs": {
                "age": {
                  "max": {
                    "field": "@timestamp"
                  }
                },
                "labels": {
                  "multi_terms": {
                    "terms": [
                      { "field": "kubernetes_namespace_name.keyword"},
                      { "field": "kubernetes_container_name.keyword"},
                      { "field": "kubernetes_pod_name.keyword"}
                    ],
                    "size": 1000
                  }
                }
              }
            }
          }
        }
      transform:
        # Save the maximum age for usage in subsequent queries and create a metric for each pair
        expr: |
          json.orValue(null) != null ?
          [{
            'detail': { 'max': string(json.?aggregations.logs.age.value_as_string.orValue(last_result().?results.max.orValue(time.Now()))) },
            'metrics': json.?aggregations.logs.labels.buckets.orValue([]).map(k,  {
              'name': "namespace_log_count",
              'type': "counter",
              'value': double(k.doc_count),
              'labels': {
                "namespace": k.key[0],
                "container": k.key[1],
                "pod": k.key[2]
              }
            })
          }].toJSON()
          : '{}'
This snippet retrieves the last_result.results.max value from the last execution ensuring data is not duplicated or missed
"@timestamp" : {
  {{-  if last_result.results.max }}
  "gte": "{{ last_result.results.max }}"
  {{- else }}
  "gte": "now-5m"
  {{- end }}
}
The max value is saved in the transform section using:
#...
'detail': { 'max': string(json.?aggregations.logs.age.value_as_string.orValue(last_result().?results.max.orValue(time.Now()))) },
#...