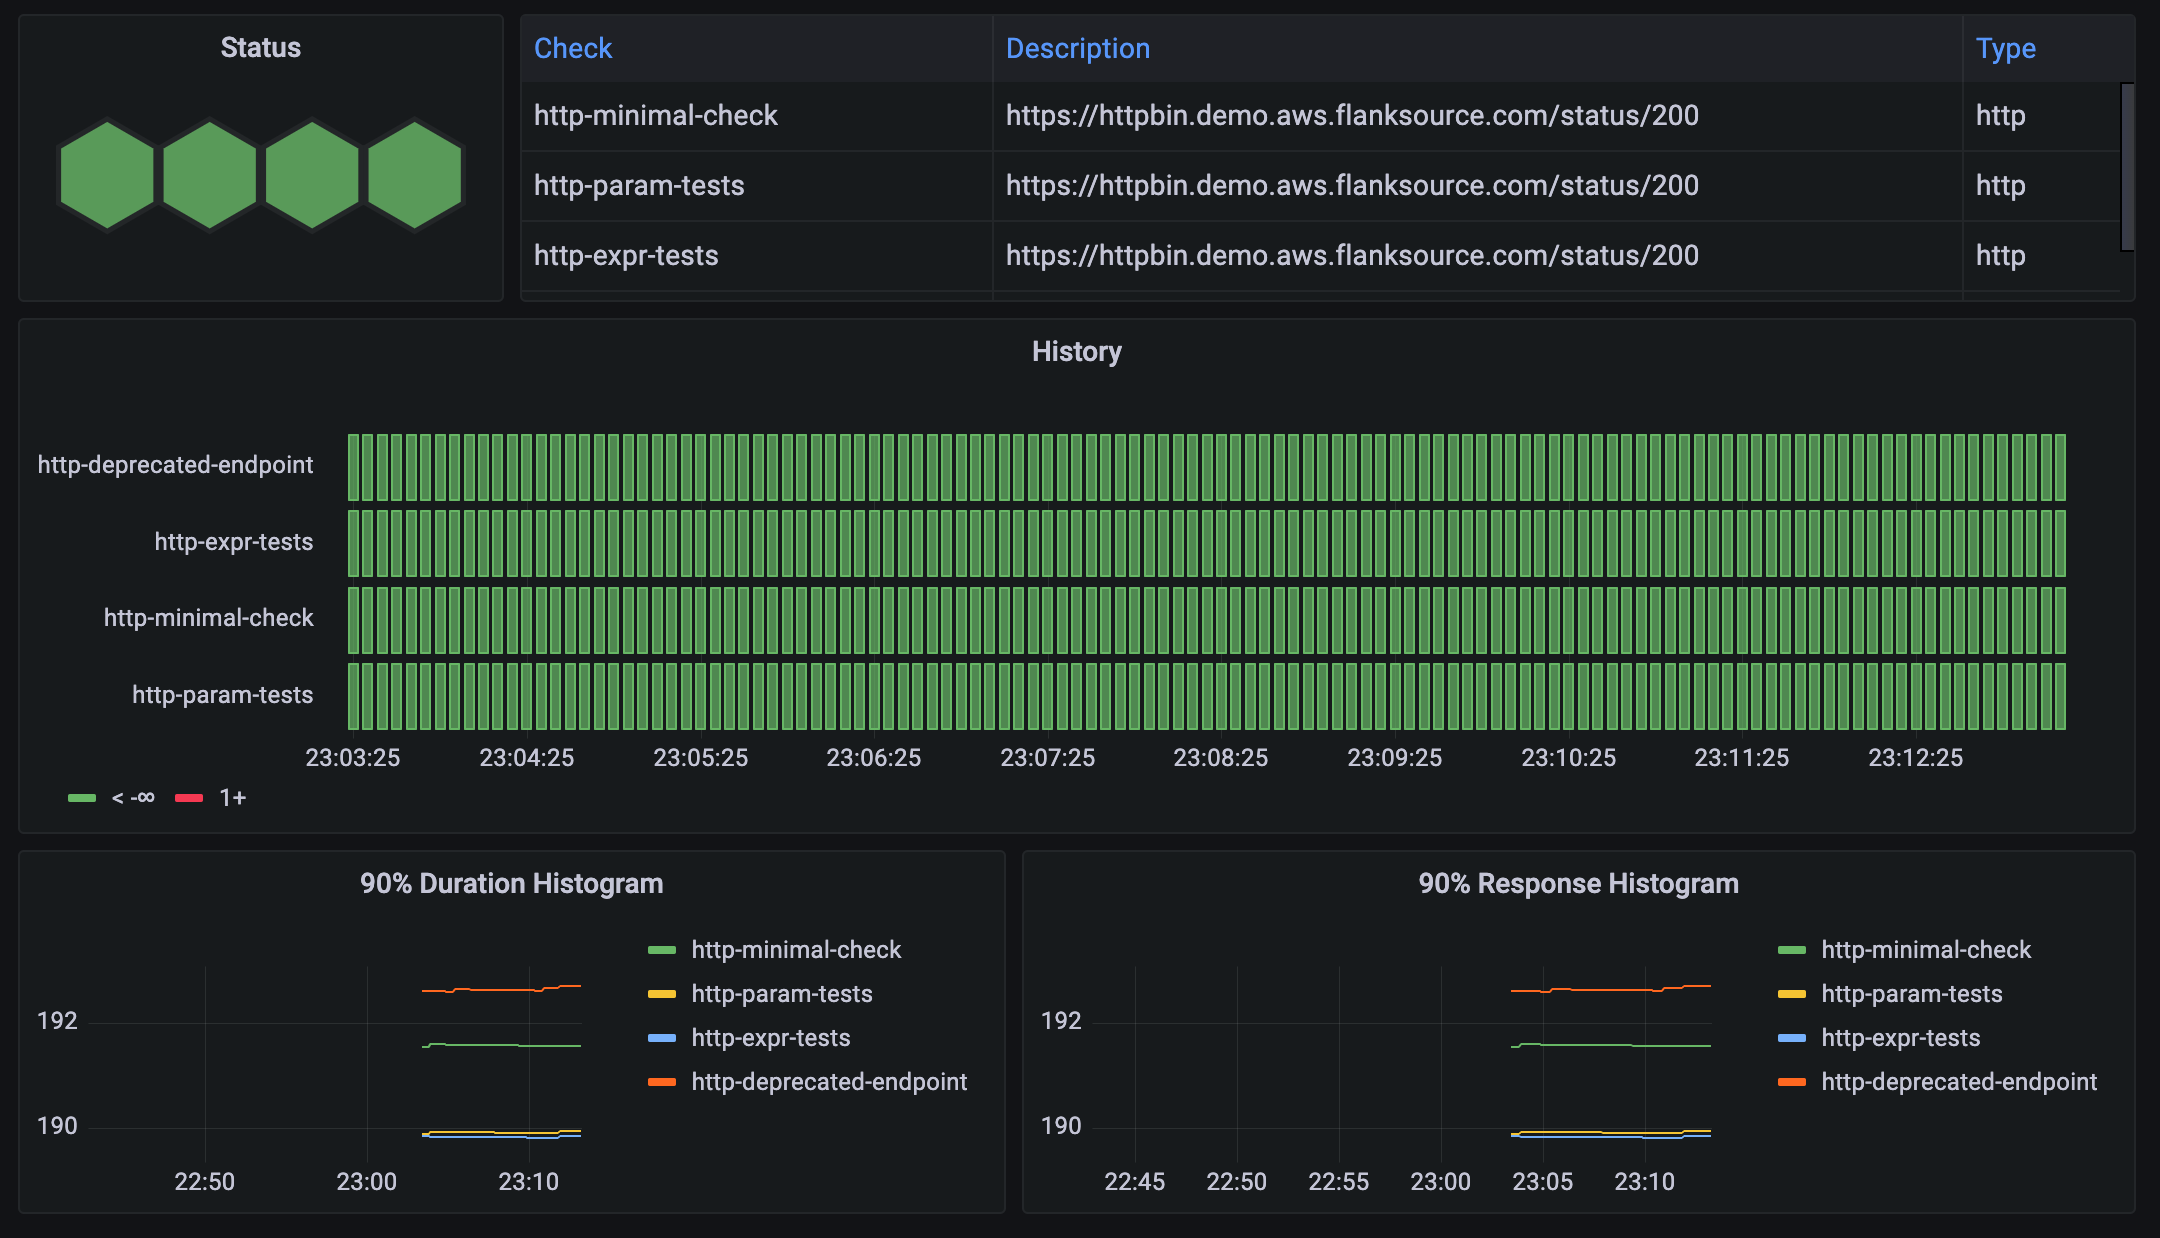
Grafana
Default grafana dashboards are available. After you deploy Grafana, these dashboards can be installed with
--set grafanaDashboards=true --set serviceMonitor=true
Prometheus
The helm chart can install a ServiceMonitor for the prometheus operator, by enabling the serviceMonitor flag
--set serviceMonitor=true
Default Metrics exposed by canary-checker:
| Metric | Type | Description |
|---|---|---|
| canary_check | Gauge | Set to 0 when passing and 1 when failing |
| canary_check_success_count | Counter | |
| canary_check_failed_count | Counter | |
| canary_check_info | Info | |
| canary_check_duration | Histogram | Histogram of canary durations |
Some checks like pod and http expose additional metrics.
tip
Custom metrics can be exported from any check, see metrics-exporter